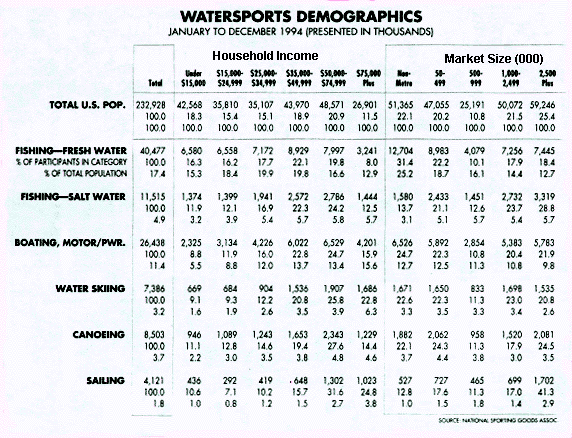
The annual January issue of Boating Industry magazine has a report on the industry in it. The report has a section on demographics. The data is from the National Sporting Goods Association. A copy of the January 1996 issue's graphic is presented below.

The Lifestyle Market Analyst
An annual published by SRDS (800) 851-SRDS
It provides information on how people spend leisure time and money
It has 7 pages of "Boating/Sailing" statistics of the nature of age, sex, home ownership, income, geographic distribution and other activities enjoyed by boaters. It has similar studies of many other recreational activities.
Margaret Ambry and Cheryl Russell have authored a number of Demographic books, some independently and some together. I suggest you find any books by them that are available to you. "The Official Guide to the Household Spending" 2nd edition. OSU call#658.834 A496c 1993 (2nd Floor Reference Area) indicates how leisure dollars are distributed through various activities and different income and age levels.
One incredible study is the annual "Study of Media and Markets" by the Simmons Market Research Bureau. It is a very large multi volume set with participation, purchase, and media consumption data. One volume (P-9) covers Sports and Leisure. This volume extensively covers boating, water skiing and fishing. The study is quite expensive. Locally, an aged copy is donated to the University of Oklahoma library after the new annual is out. OU library call #HF 5415.3 S542 199_. PT.9. The "_" is the last digit of the year. It has frequency of participation by sex, age, education, job, geography, income, etc. One of the most interesting things is it has relative frequency data of participation for readers, listeners, or watchers of media by specific newspaper, TV show, Radio show, etc. This data can be used to profile boaters by what they like and don't like.
Marine Matrix
1800 Sherman Avenue - Suite 510
Evanstown IL 6201-3789
"1990 Statewide Survey of Boating Use at Public Waterway Access Sites in New York State" is a February 1992 report prepared by the Office of Parks, Recreation and Historic Preservation for the Department of Environmental Conservation of New York State.
You might check with state Fish and Wildlife Department officials to see if they are aware of any studies of this nature in your area.

Return to Recreational Boat Building Industry Home Page